
In this technical post, I’m gonna talk about optimization, and specifically about memory allocations in Unity.
Disclaimer: I’m in no way an expert in this area, and you should take anything from this article with caution, as it may not be perfectly accurate, or there may be better solutions than the ones I give. Let’s say it’s a basic overview of tips about reducing allocations.
Second disclaimer: Some methods are here to reduce allocations, but it sometimes goes against speed performances (reasonably). Just choose what you’re looking for; it is for example more important on a mobile app than on a desktop game.
Short introduction
Working on my mobile game, I didn’t care too much about performances or allocations (I usually try to write clear, flexible, readable code without doing premature optimization) until I faced issues on device. I began with some obvious fixes, like packing sprites to improve compression, which made the game a lot more playable. Still, there were frequent micro-freezes that were almost not noticeable at first, but became unbearable as soon as I took note of them.
After some digging and playing around in the profiler, I found out those were due to some line named GC.Collect. I knew what garbage collection is, but didn’t really think about it until now, since it had never been an issue since I learned about it in school. In my project, it can take up to 8.62ms (on my high-end pc), leading to 9.79ms needed for my behaviours updates on a given frame; I didn’t check on device, but it was enough to be seen.
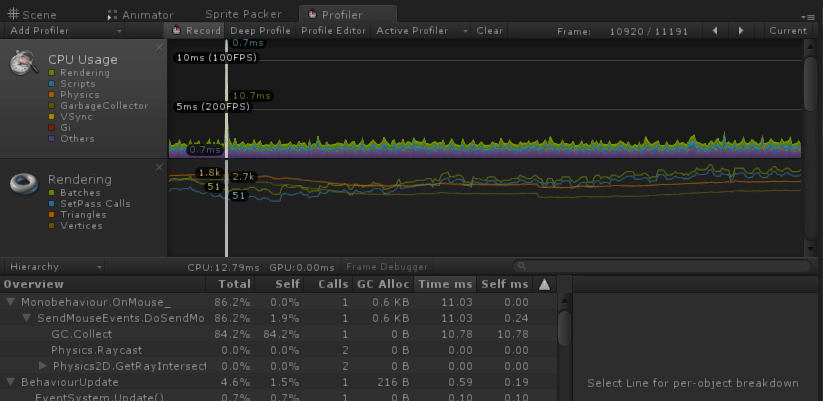
From Unity doc: “When an object, string or array is created, the memory required to store it is allocated from a central pool called the heap.” And the GC.Collect, which can happen anytime, as soon as the heap requires it, empties this memory by collecting garbage, looking through all the objects to see if they are in use or not. This operation can take quite a long time if there are many objects, dead or still alive.
Since I use pooling for almost everything in my game, I couldn’t really imagine where those alloc came from (the place it shows up in the profiler isn’t necessarily related to what really caused it). So I began investigating about this on the interwebz, and here are some tips on mistakes to avoid and methods to track them.
Reuse
The first obvious thing to say is: don’t create “new” things once your game is initialized/your scene is loaded. For your prefabs and even for components, use pooling and immediately instantiate everything you may need later. It also applies to arrays, list and dictionary, for example in an Update function where you have to fill an array every frame. Create one when the class starts, giving it the expected size as parameter, then clear it when you need it empty, instead of recreating it. It will keep its allocated space, and you can fill it again without extra allocation. Those are often very small allocs, but if they keep happening every frame, they will eventually cost more than the bigger ones that happen less frequently.
If you have a method filling an array or a list, pass it as an argument of the function instead of making it its return value. Have your collection be a member of the class, initialized only once, then simply cleared and filled inside your method, so you don’t have to instantiate a new one every time.
The strings create garbage as well, even when you concatenate them, so if you have to handle a lot of text somewhere and manipulate it heavily, use a StringBuilder that will take care of those memory issues alone and avoid the creation of garbage.
In the same spirit, cache everything you need to check frequently. If GetComponent is supposed to only allocate memory in the editor and not on device, other functions like GetComponentsInChildren will never be good to use on a regular basis (which is obvious since it returns an array). So call it once if you need it, then keep the result to reuse it and update it if needed.
Best practices
Another well-known garbage creator is the foreach. Because of Boxing (I’ll let you look for it if you want to go in detail), a foreach loop used on a collection containing objects creates garbage, so just use a simple for loop.
Some basic methods or functionalities provided by Unity also generate garbage for weird reasons. The best way to track them is to use the profiler after encapsulating your code in Profiler.BeginSample(“SampleName”) / Profiler.EndSample(). Those sections will have their own line in the profiler, allowing you to find exactly what line generates garbage and finding those tricky allocs.
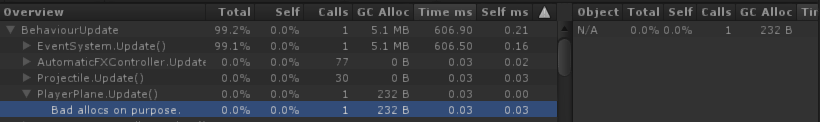
Vector3.Equals, for example, generates garbage; just compare the coordinates of your vectors one by one. Also, don’t use enum values as dictionary keys, cast them to int. There must be several other tips of this kind which I did not have to deal with, so be sure to profile until you find the very line making the alloc.
Finally, you can trigger the garbage collector by yourself by calling System.GC.Collect(). I naively tried to call it every 30 frames, so that the garbage don’t have the time to grow, but the thing is that garbage collection duration will take as much time whether it has a lot to clear or not, because it scales with the total amount of objects. The best thing to do (besides not allocating anything) is to call this at the right time: just before starting the gameplay, when the player pauses the game, during loading of cutscenes… In those occasions, the collection spike will be invisible to the player (but your code still has to be clean enough so that it doesn’t need to be called outside of those circumstances).
Limits
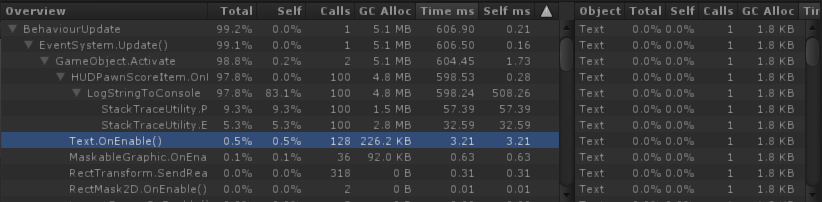
Sadly, some of Unity’s methods generating garbage can’t really be avoided without doing some programming weird tricks. I couldn’t find anything about some obvious “leaks”, like Text.OnEnable or OnGUI functions, which can generate quite a lot of garbage if you use them frequently.
In those cases, if you don’t want to recode yourself the whole system, you’ll have to be smart about the way you call them. Maybe you could just put that label offscreen when it’s not used, instead of disabling it? Rather than calling Clear/Stop on your particle system when it’s not used anymore, store its end date when starting it (don’t check each frame if it’s still alive!), and if it went until the end when you don’t need it anymore, don’t bother clearing it.
There are a bunch of other methods from Unity that allocate memory on the heap, some of which you can bypass, some of which you’ll just have to deal with. Just remember that it’s not always essential to reach 0 alloc; if a function called once in a while generates some KB of garbage, maybe it’s ok, as long as it’s not every frame. Optimize wisely.
Some other perf considerations
To end this note, I’d like to point out some very easy optimizations to improve performances:
On the rendering side, there is a lot to do. Pack your sprites in atlases, use an uniform scale on all of them in game, don’t modify the shared material of only one instance. In my project for example, I used an additive shader to make the enemies blink in white when hit, but every time I did that, a new instance of the material was spawned, and the enemies couldn’t be correctly batched anymore. Instead, I added a white sprite of the hit enemy, and just enable/disable it when needed (which fortunately doesn’t have the same memory impact as UI.Text).
On the physics side, it can often be easy to optimize things as well, if you started with a naive approach. Check your collisions matrix, remove all unnecessary cases. Try to use less colliders if you have several of them on some objects, prefer circle/sphere colliders to square/box or capsule ones. If you use Unity’s UI system, disable the “UI Raycast Target” option (checked by default) on everything that doesn’t need it.
Don’t leave empty Unity callbacks, especially like Update or FixedUpdate: because of the way they are called, it can be costly if you have a lot of behaviours, even if there is no code in them.
Well, that’s all for today. Please get in touch if you see mistakes or inaccurate advices so I can fix it before more people read it!
If you liked it and want more, don’t hesitate to subscribe to this blog, or follow me on Twitter: @Grhyll.
Thanks for reading!
Further readings:
Unity doc: understanding automatic memory management
Unity blog post: 1k update calls
C Memory Management for Unity Developers (a bit old)
Great article. I’ve been doing a lot of memory profiling myself and I’ve found that coroutines produce garbage every frame! I’ve been using coroutines for years and it wasn’t until I looked that I found the source of this leak.
Good point! I usually don’t use coroutines, so I forgot to mention it, but they are pretty convenient in many cases. I read something about their usage, and I think the author gave some ways to use them so that it becomes acceptable, but I can’t find this source anymore…